Quickly making large DAGs with DAGitty
The software DAGitty is really useful for representing causal diagrams and has wonderful documentation. It also comes with a really handy R package accessible through CRAN which can be used to query the DAG for causal effect identification, such as d-separation of variables.
To do this, we need to build a DAG object. In R, an graph object can be specified by naming the causal connections directly for example as follows:
library(dagitty)

g <- dagitty('dag {
v1 [pos="0.591,0.095"]
v2 [pos="0.693,0.223"]
v3 [pos="0.483,0.255"]
v4 [pos="0.347,0.210"]
v5 [pos="0.440,0.065"]
v1 -> v2
v2 -> v3
v4 -> v3
v5 -> v1')

plot(g)
This gives us the following image for the DAG:
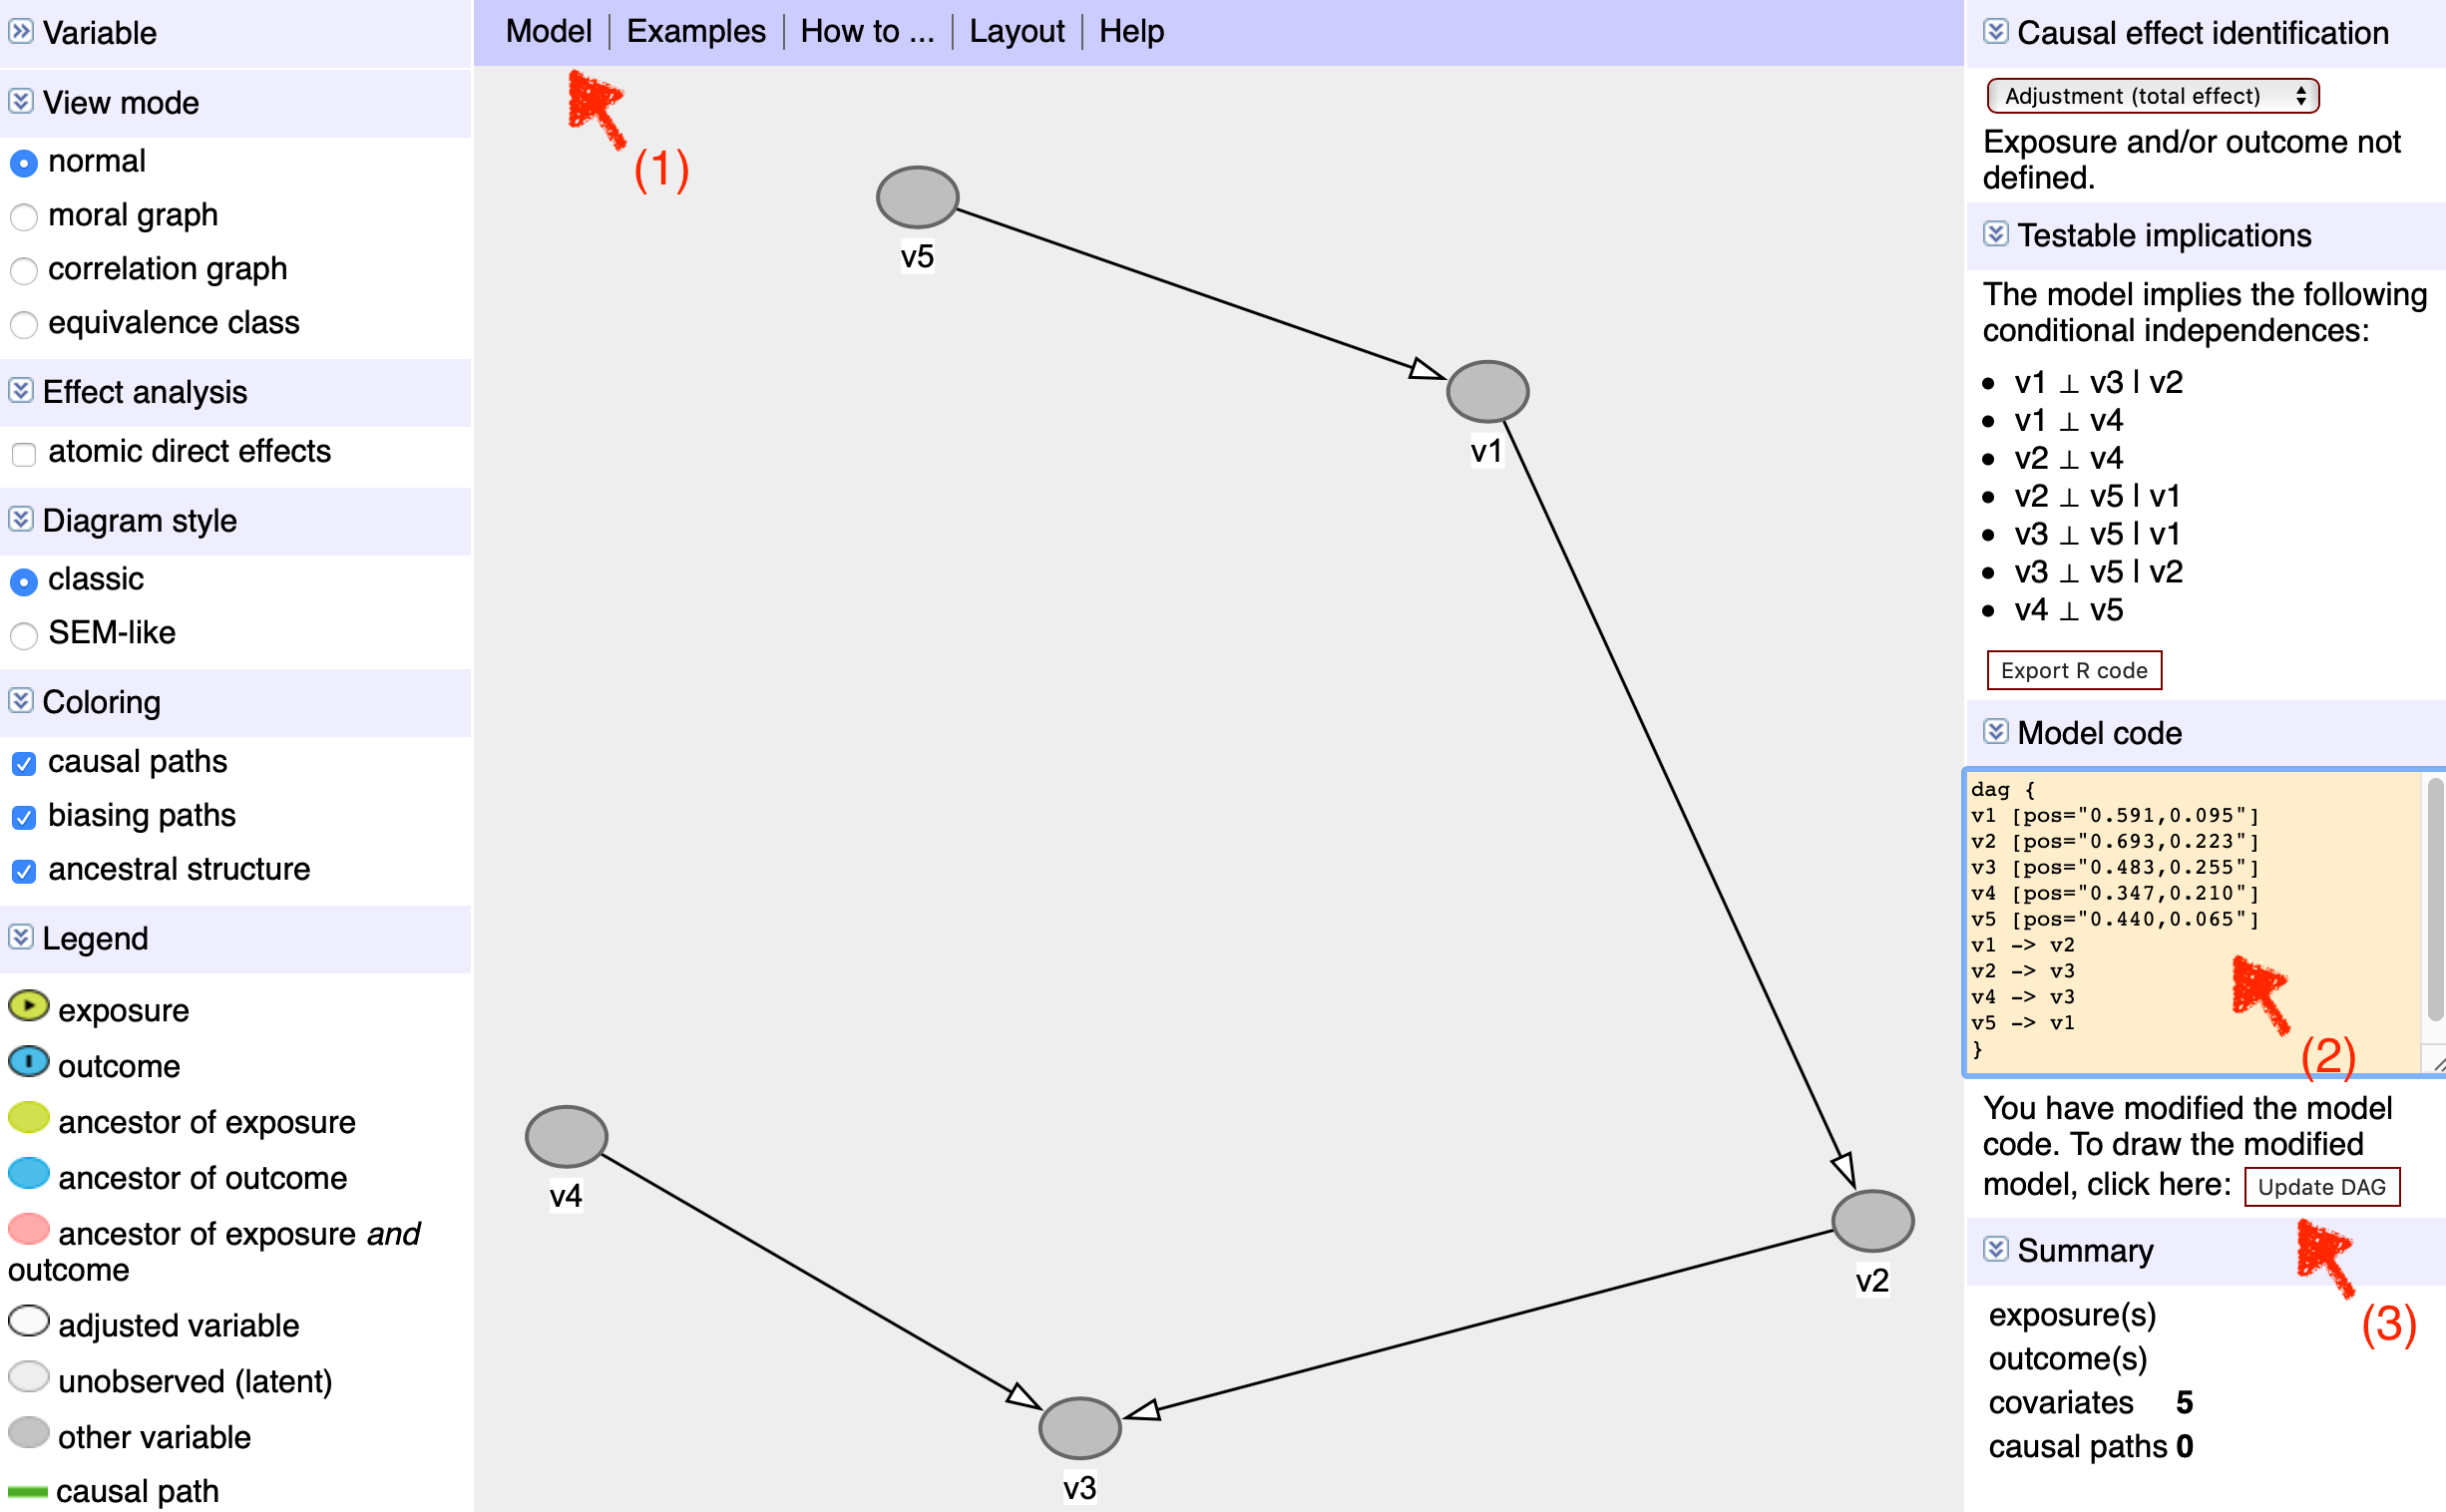
However, graphs with large number of variables is hard to draw in R because you have to type out each of teh connections. Fortunately it’s easier to assemble such graphs by navigating to the dagitty online interface. Here I’ve listed the steps associated with the image below:

-
Click on Model –> New Model.
-
If you have a list of variables as text, copy and paste them into the ‘Model code’ box indicated by teh second red arrow within the curly brackets of the command “dag { } “ (see also section 3.2 from the 2020 version of the manual). Thankfully, you do not need to specify position as it can be auto generated in step 3. After leaving a blank line, you can also add connections between variables such as “v1 -> v2” in the argument (though it can be easier to add these connections after step 3, directly on the web interface).
-
Click on the dialog box “upload DAG” to generate the image of the graph.
When the graph object is generated on the screen, it becomes much easier to add connections since you can just click on the start variable then the end variable. The graph can also be dragged to easily reposition the variables. You’ll notice the graph code within ‘Model code’ will also change accordingly. When you have finished, you can take the model code from this box and bring it back to R by pasting it as a string within the dagitty() argument, where you can do more complex things with the graph such as query conditional independencies.
> impliedConditionalIndependencies(g )
v1 _||_ v3 | v2
v1 _||_ v4
v2 _||_ v4
v2 _||_ v5 | v1
v3 _||_ v5 | v1
v3 _||_ v5 | v2
v4 _||_ v5

> dseparated( g, "v1", "v3", c("v2" ) )
[1] TRUE
