Exploring ggh4x
The package ggh4x provides an extension to base ggplot2 package with some useful additional functionality.
grid facets with multiple distinct subplots
In ggplot2 we can have a facet_grid plot that have scales different for each row and column by setting scales=”free”. However to get different scales for individual facets we would need to use facet_wrap.
library("ggplot2")
# > packageVersion("ggplot2")
# [1] ‘3.4.1’
library(ggh4x)
# > packageVersion("ggh4x")
# [1] ‘0.2.7’

## the ggplot2 implementation
ggplot(mpg, aes(cty, hwy)) + geom_point()+
    facet_grid(vars(drv), vars(cyl), scales = "free")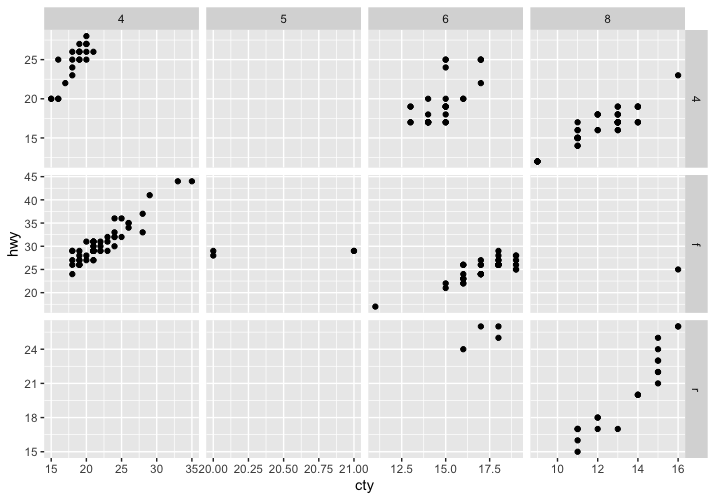
However if we now implement facet_grid with ggh4x, we are able to scale the x and y-axis distinctly within each facet of the grid if we use the option ‘independent’. To do this we can specify a scales object ‘position_scales’ which defines the scale for each facet.
## the ggh4x implementation
#### set scales.
position_scales <- list(
  scale_y_continuous(limits=c(0,30)),
  scale_y_continuous(limits=c(0,100)),
  scale_y_continuous(limits=c(0,700000)),
  scale_y_continuous(limits=c(0,100)),
  scale_y_continuous(limits=c(0,100)),
  scale_y_continuous(limits=c(0,100)),
  scale_y_continuous(limits=c(0,30)),
  scale_y_continuous(limits=c(0,100)),
  scale_y_continuous(limits=c(0,30)),
  scale_y_continuous(limits=c(0,100)),
  scale_y_continuous(limits=c(0,100)),
  scale_y_continuous(limits=c(0,100)),
  scale_y_continuous(limits=c(0,30)),
  scale_y_continuous(limits=c(0,30)),
  scale_y_continuous(limits=c(0,30)),
  scale_y_continuous(limits=c(0,30))
)
#### do plot
ggplot(mpg, aes(cty, hwy)) +
  ggh4x::facet_grid2(vars(drv), vars(cyl),
             scales="free_y",
             independent = "y")+
    ggh4x::facetted_pos_scales(
    y =position_scales)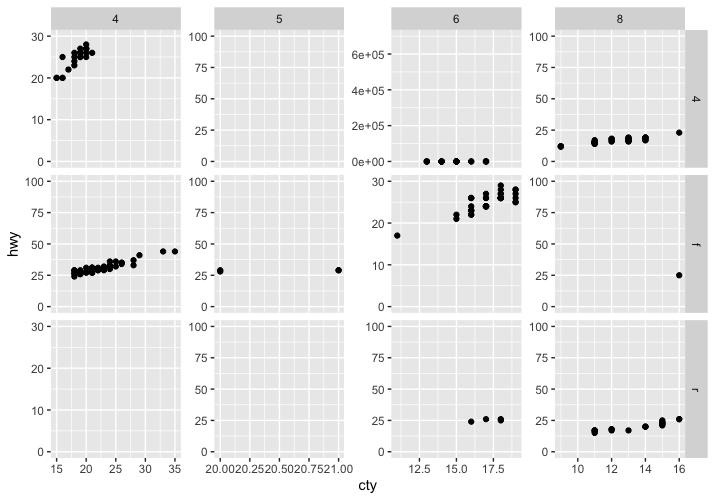
Written on September 8, 2023